Google Analytics in BlueIQ
See your website visits and key events next to new patients.
- Live dashboards and team goals
- Text and email alerts on any number
- Reports delivered on your schedule
- Google Analytics next to your practice numbers
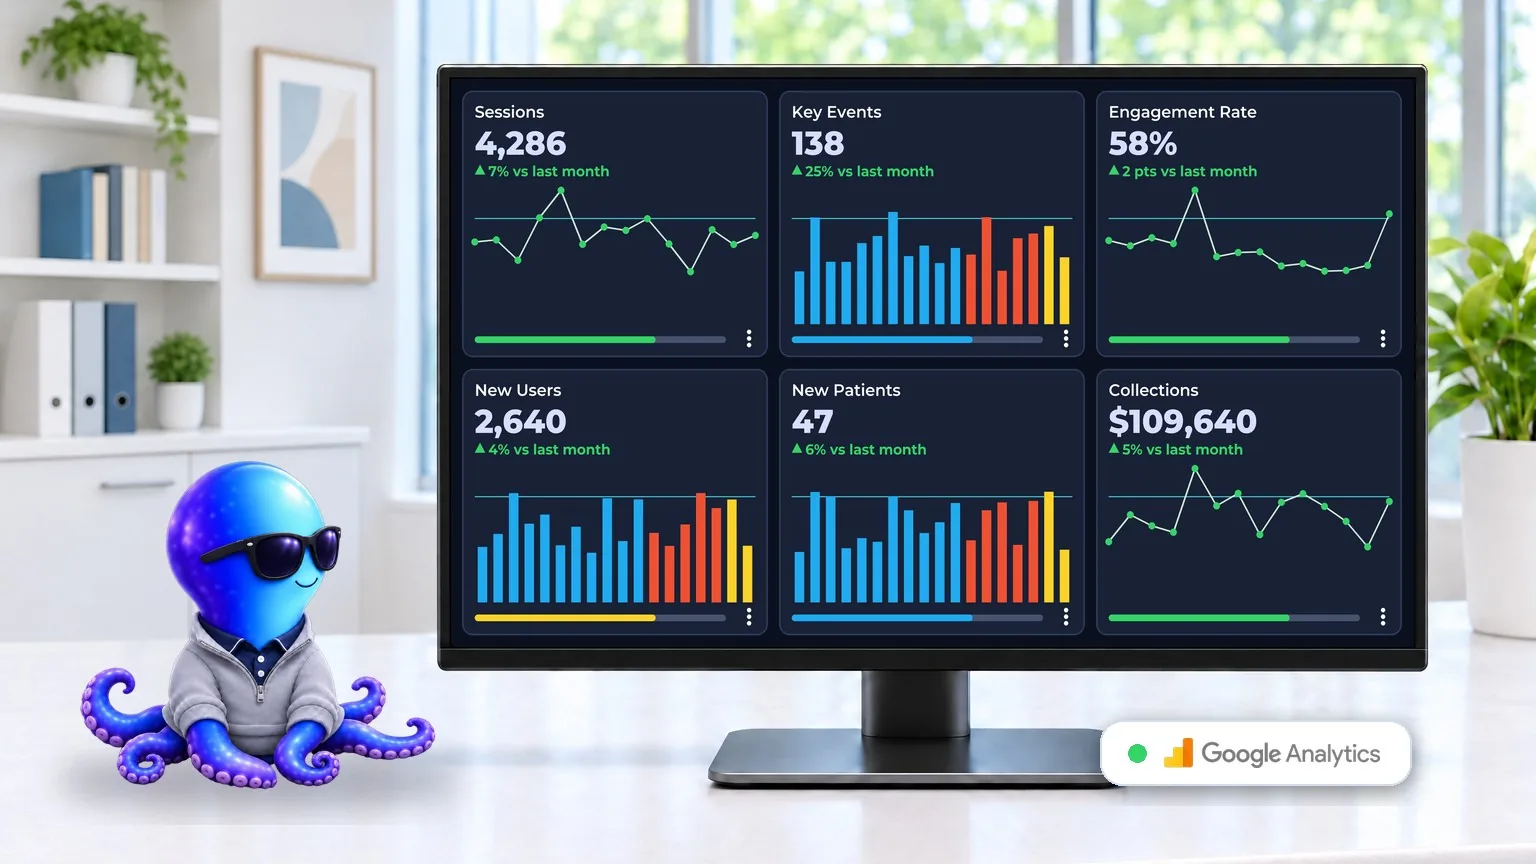
Your website is busy. Is it bringing in patients?
BlueIQ connects to Google Analytics 4 and shows your website numbers on the same dashboard as your practice numbers from Open Dental, Dentrix, Eaglesoft, ChiroTouch, Pryme Practice or Genesis. No supported system? BlueIQ Dash works with numbers you enter yourself. See whether more visits to your website mean more patients in the chair.
Google Analytics is hard to read
Most owners don't have time to learn Google Analytics. BlueIQ shows the few website numbers that matter in plain tiles.
Visits and patients in one place
See website visits and form fills on the same screen as new patients, instead of guessing how they line up.
Know when the website slows down
A drop in visits or form fills shows up next to your other numbers, so you can ask your marketing team about it early.
Your website numbers, next to your practice numbers
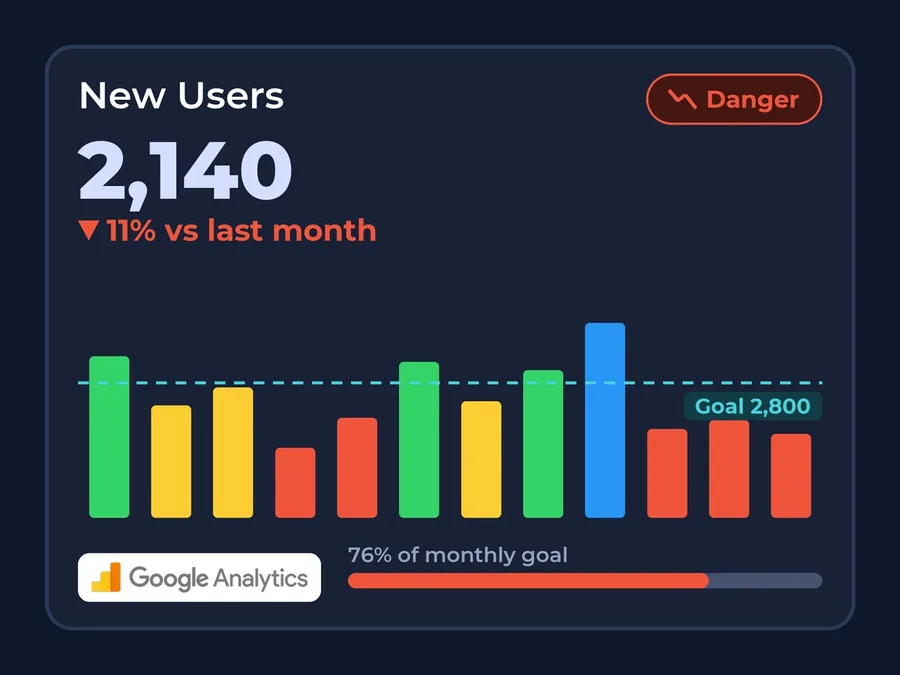
BlueIQ colors each number by how it compares to your goal, so you can tell at a glance what's working and what needs attention, and it flags a trend before it costs you.
You set the goals, the color ranges and the alert thresholds, for every metric.
What the colors mean (default ranges)
- Overachieving (blue): 120% or more of goal
- Goal Met (green): 100 to 119% of goal
- Slipping (yellow): 80 to 99% of goal
- Danger (red): below 80% of goal
Four kinds of alerts, by text or email
- Goal alerts tell you the moment a number hits its goal
- Trend alerts fire when a number stays Overachieving, Goal Met, Slipping or in Danger for periods in a row
- Threshold alerts fire when a number goes above or below any value you choose
- Status alerts send regular progress updates, daily or weekly
Every period is colored this way, so a run of yellow or red stands out before month end. Goals can also update themselves each period from your own trend.
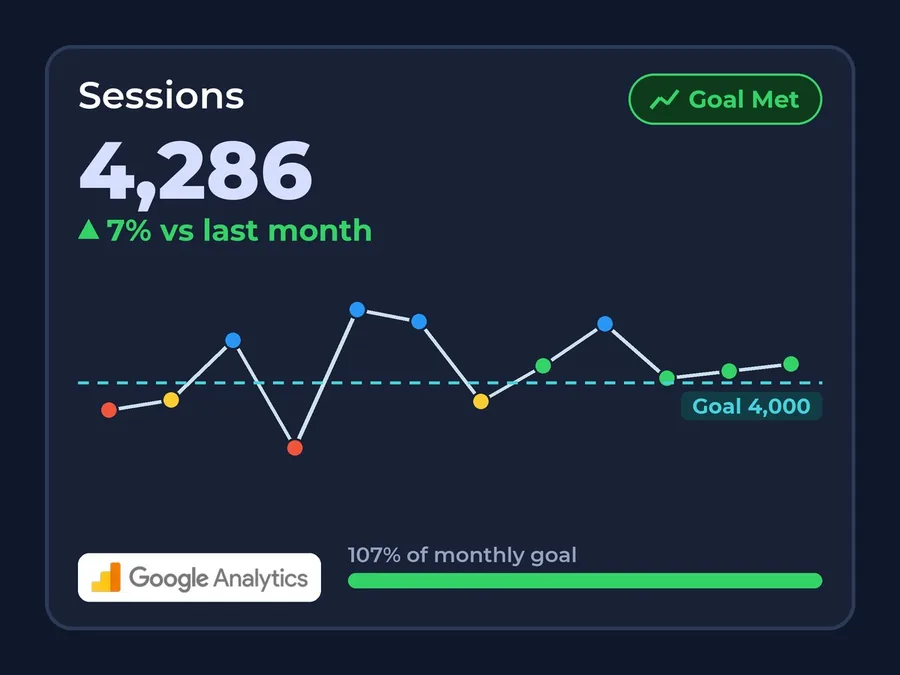
Website visits
Sessions, views and pageviews, charted by day, week or month.
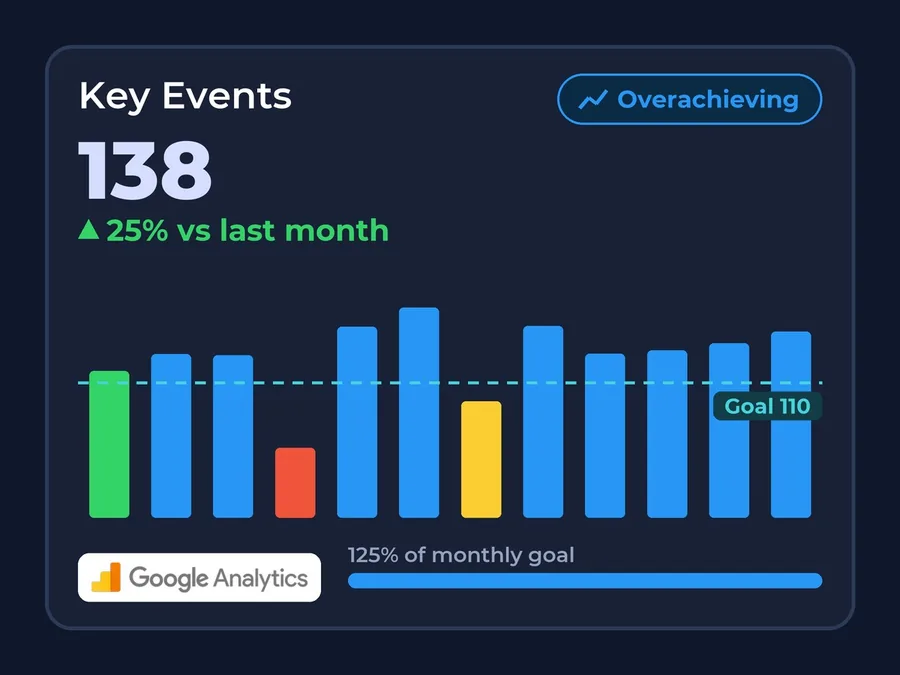
Form fills and phone clicks
Key events such as form submissions, phone clicks and chat starts, or any action you mark as a key event in Google Analytics, plus conversions.
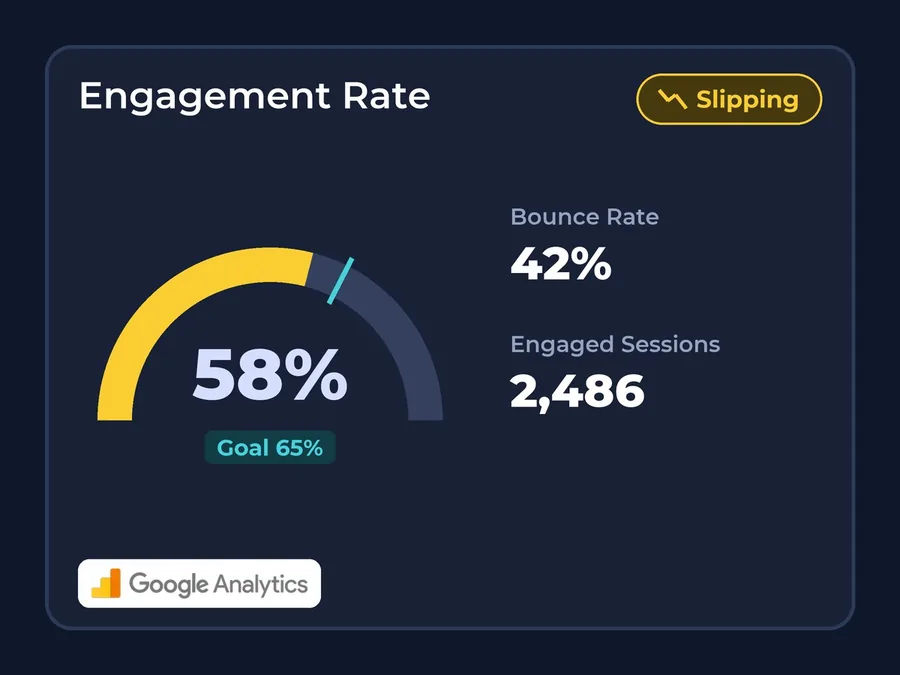
Visit quality
Engagement rate, bounce rate, engaged sessions and average session length, shown as a total for the dates you pick.
New and returning visitors
New users, active users and total users for the dates you pick.
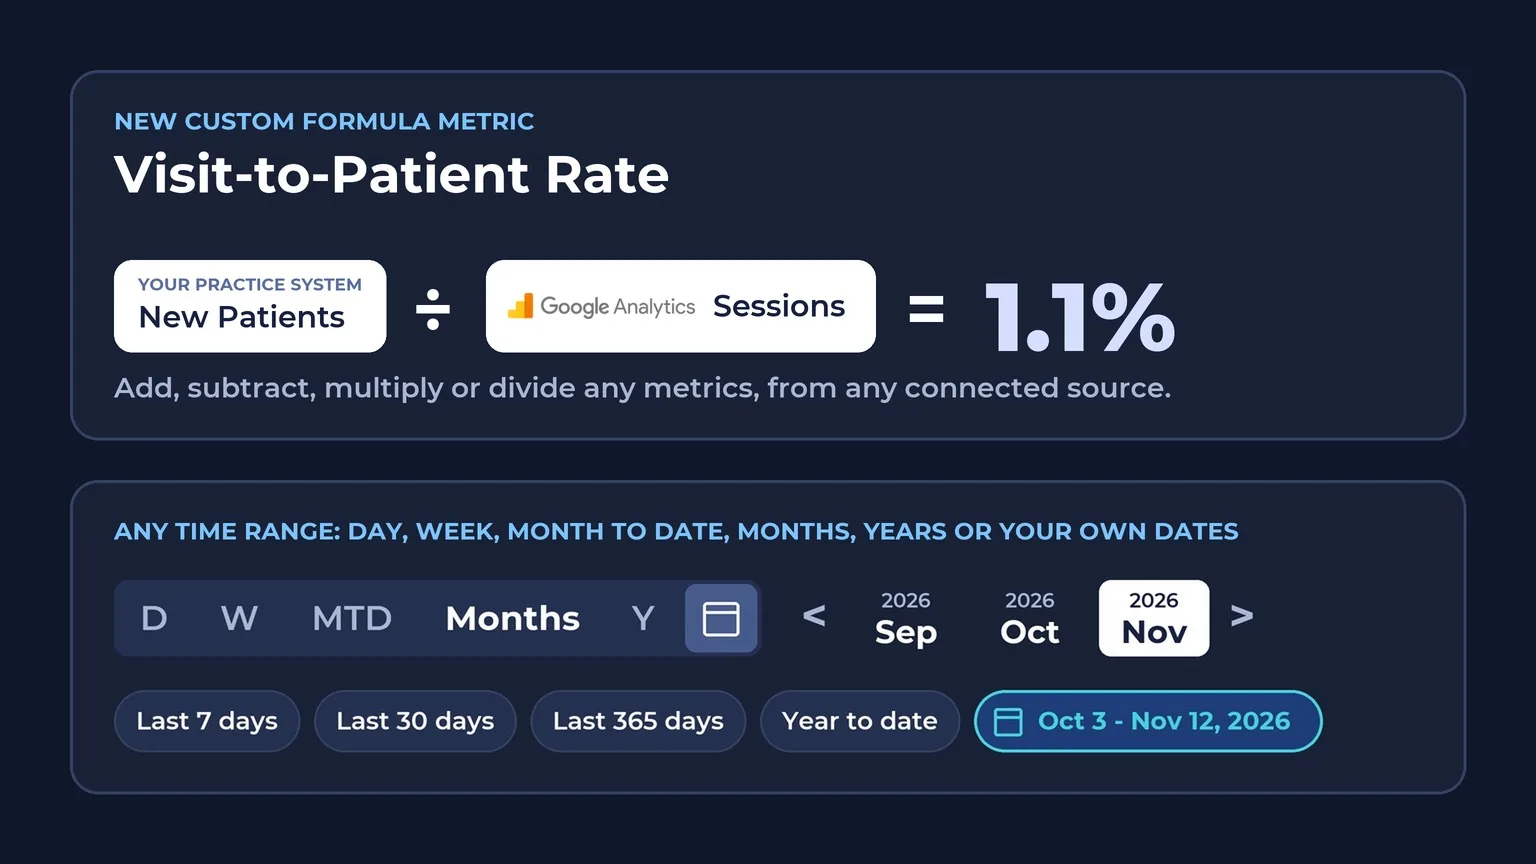
Connect website traffic to new patients
Put Google Analytics tiles on the same dashboard as new patients, production and collections from your practice system. Build your own formulas, like new patients per 100 website visits, and add Google Ads and Facebook to see your whole marketing picture in one place.
Seamless Setup
3 easy steps. We do the technical work, and your team keeps working in the tools they already use.

- 1Book a demo and pick your plan.
- 2Sign in to Google Analytics from BlueIQ and pick your account.
- 3Add Google Analytics numbers to your dashboards.
Google Analytics questions
Does BlueIQ work with Google Analytics 4?
Can I see website visits next to my new patients?
Can I track form fills and phone clicks from my practice website?
Can I see my website traffic over time?
Does Google Analytics work with BlueIQ if my practice system isn't supported?
Is it safe to connect Google Analytics to BlueIQ?
See your website next to your practice numbers
Book a 45-minute demo and see how your website traffic and your new patients look on one screen.
- No contracts
- Unlimited users and unlimited training
- Practices in one of our partner consulting or coaching groups get 20% off.
Not ready for a demo, or not sure BlueIQ is the right fit?
Get a Cashflow Blueprint instead. We look at your practice data and show you, in dollars, what your practice is missing and how fast BlueIQ would pay for itself.
Get my Blueprint